GitHub Actions / Terraform
Infrastructure begins as reviewed code.
The deployment workflow applies a repeatable AWS environment instead of relying on resources assembled manually in the console.
Case study 02 · Cloud data pipeline
A cloud pipeline that turns repository history into traceable datasets and engineering dashboards.
01 / Problem
A local repository-analysis script can calculate useful metrics, but it does not prove orchestration, infrastructure or data-platform thinking. I wanted every stage—from source repository to dashboard—to be visible and reproducible.
That meant separating raw evidence from transformed outputs, tracking each execution, and making the pipeline queryable rather than ending with an opaque report.
How can repository analysis become a repeatable cloud data product rather than a one-off script?
02 / Architecture
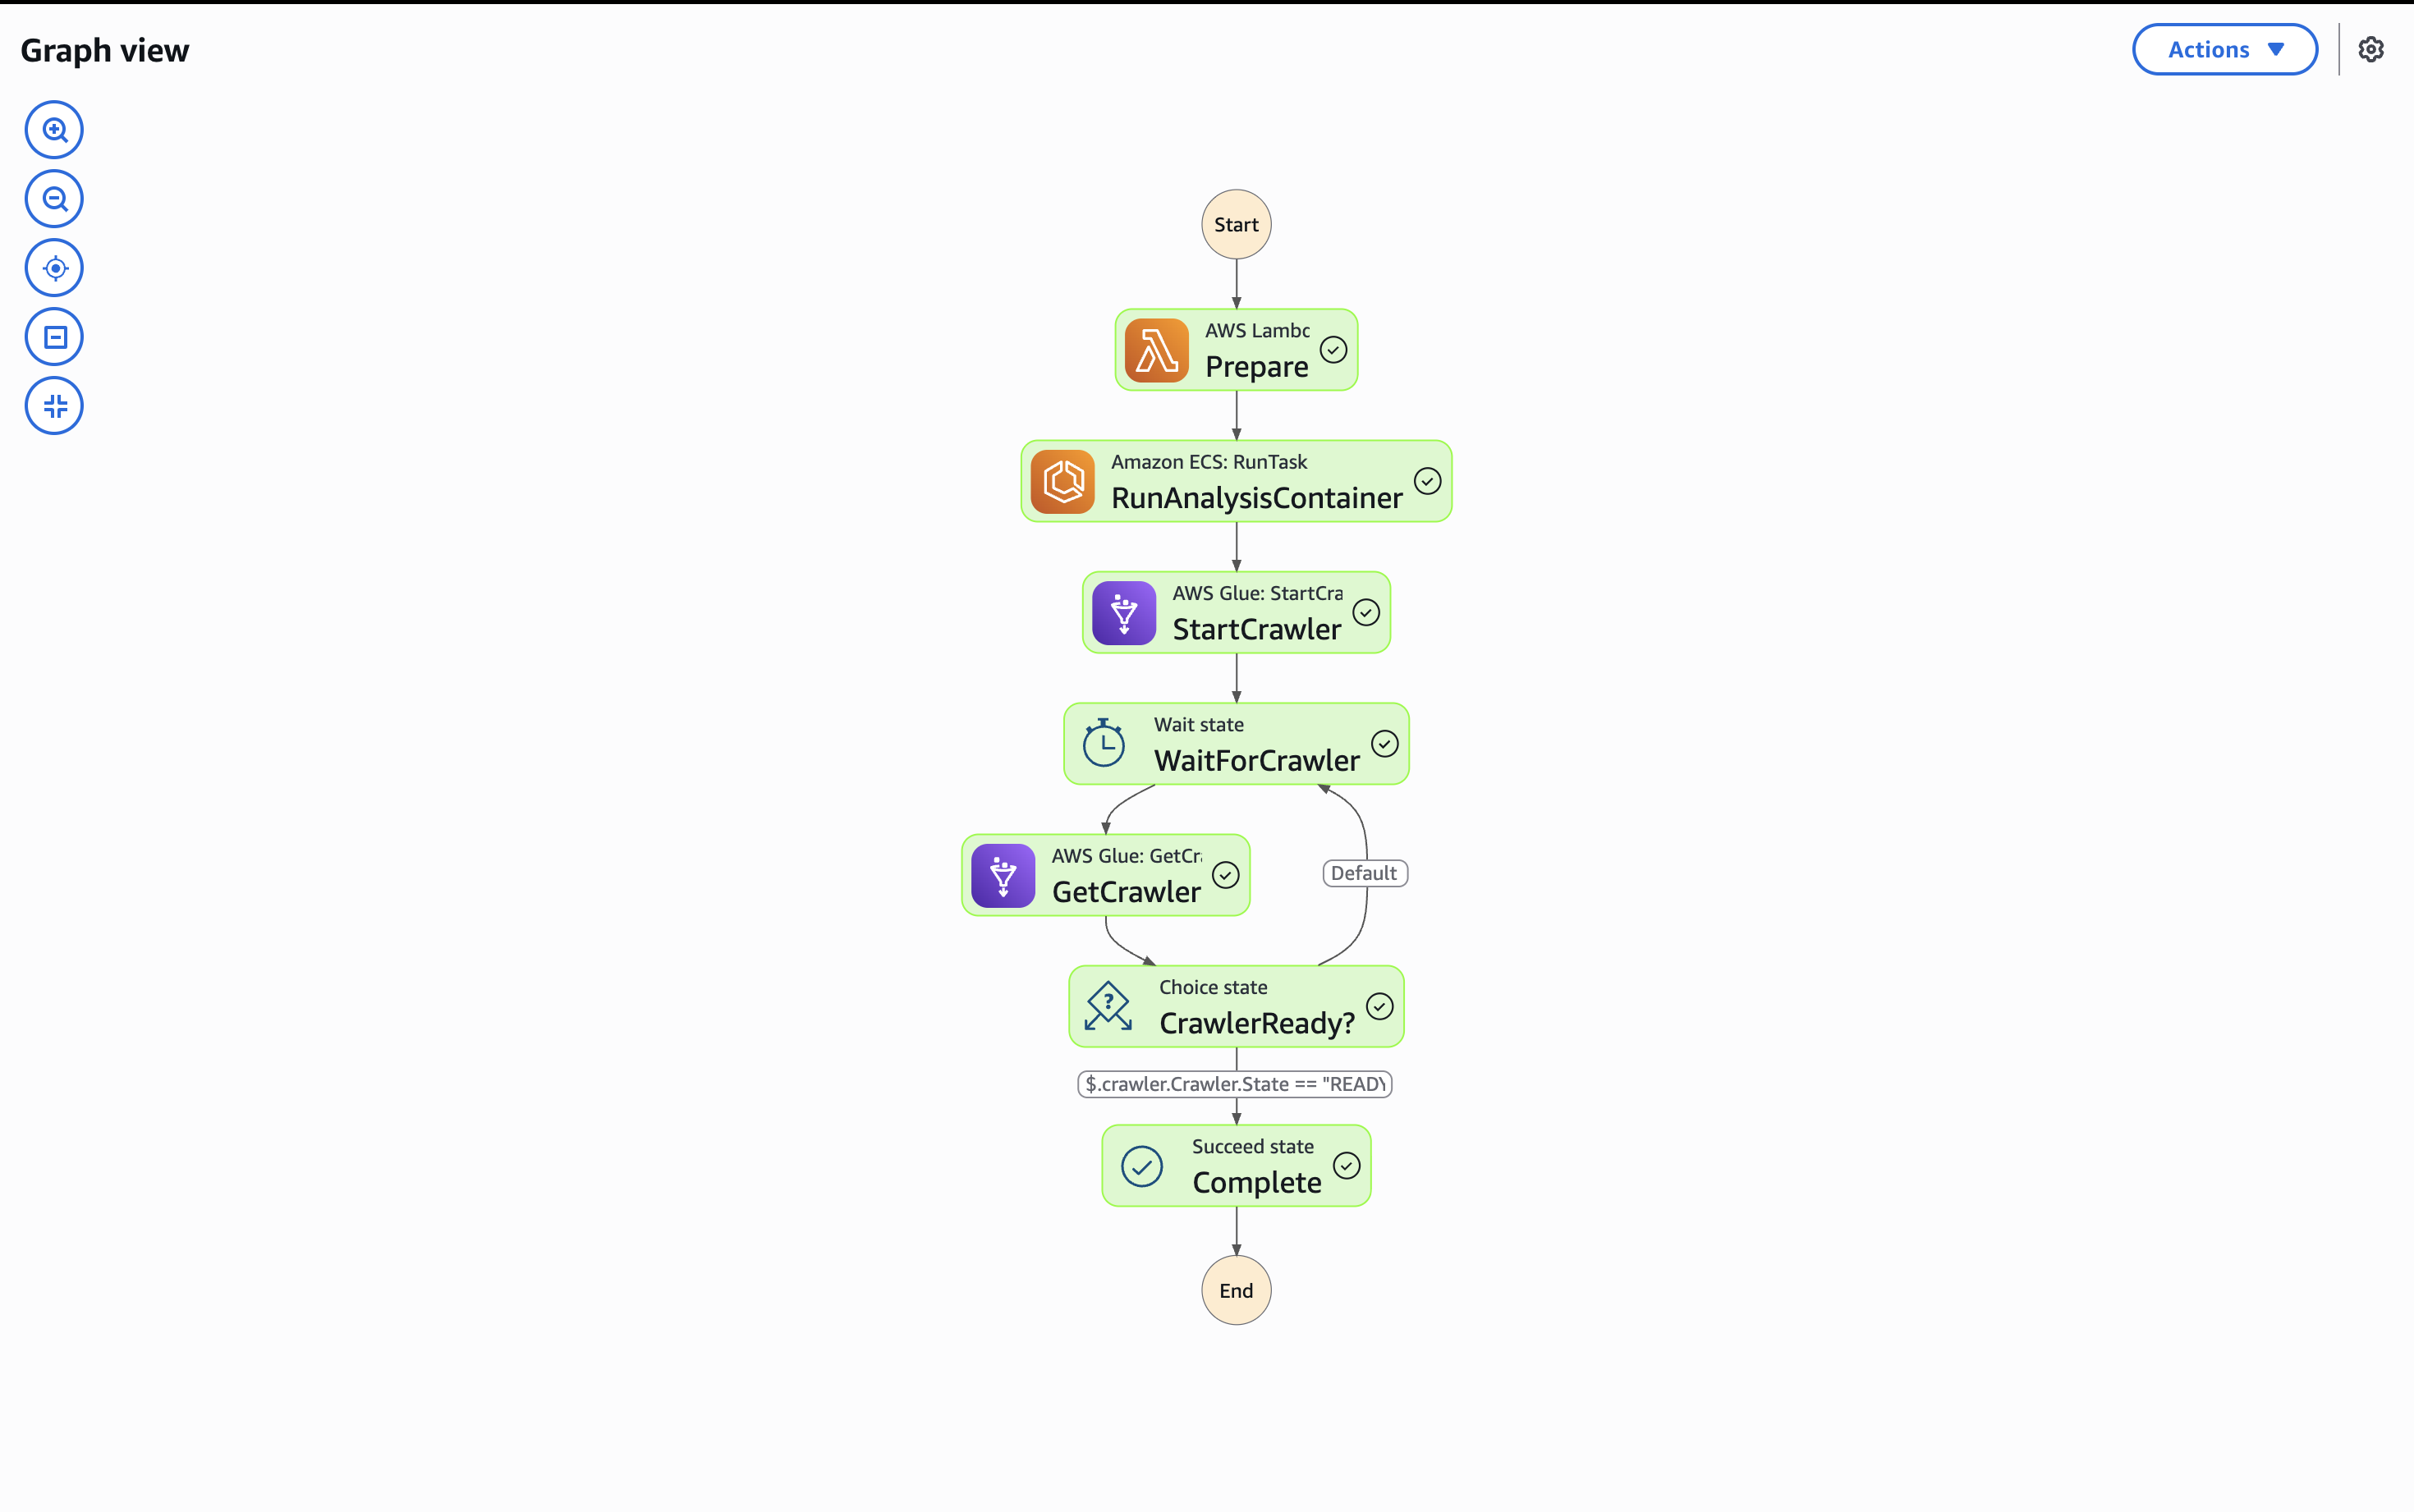
GitHub Actions and Terraform define the environment. Step Functions coordinates the run, ECS Fargate performs analysis, and S3 preserves raw, processed and curated layers. Glue, Athena and QuickSight form the query and presentation layer.
03 / Walkthrough
GitHub Actions / Terraform
The deployment workflow applies a repeatable AWS environment instead of relying on resources assembled manually in the console.
Step Functions / ECS
Step Functions creates a visible, retryable orchestration path. ECS Fargate handles analysis workloads that can outgrow a small function runtime.
S3 / Glue
Raw, processed and curated data stay separate. Explicit execution IDs prevent dashboards from silently mixing unrelated runs.
Athena / QuickSight
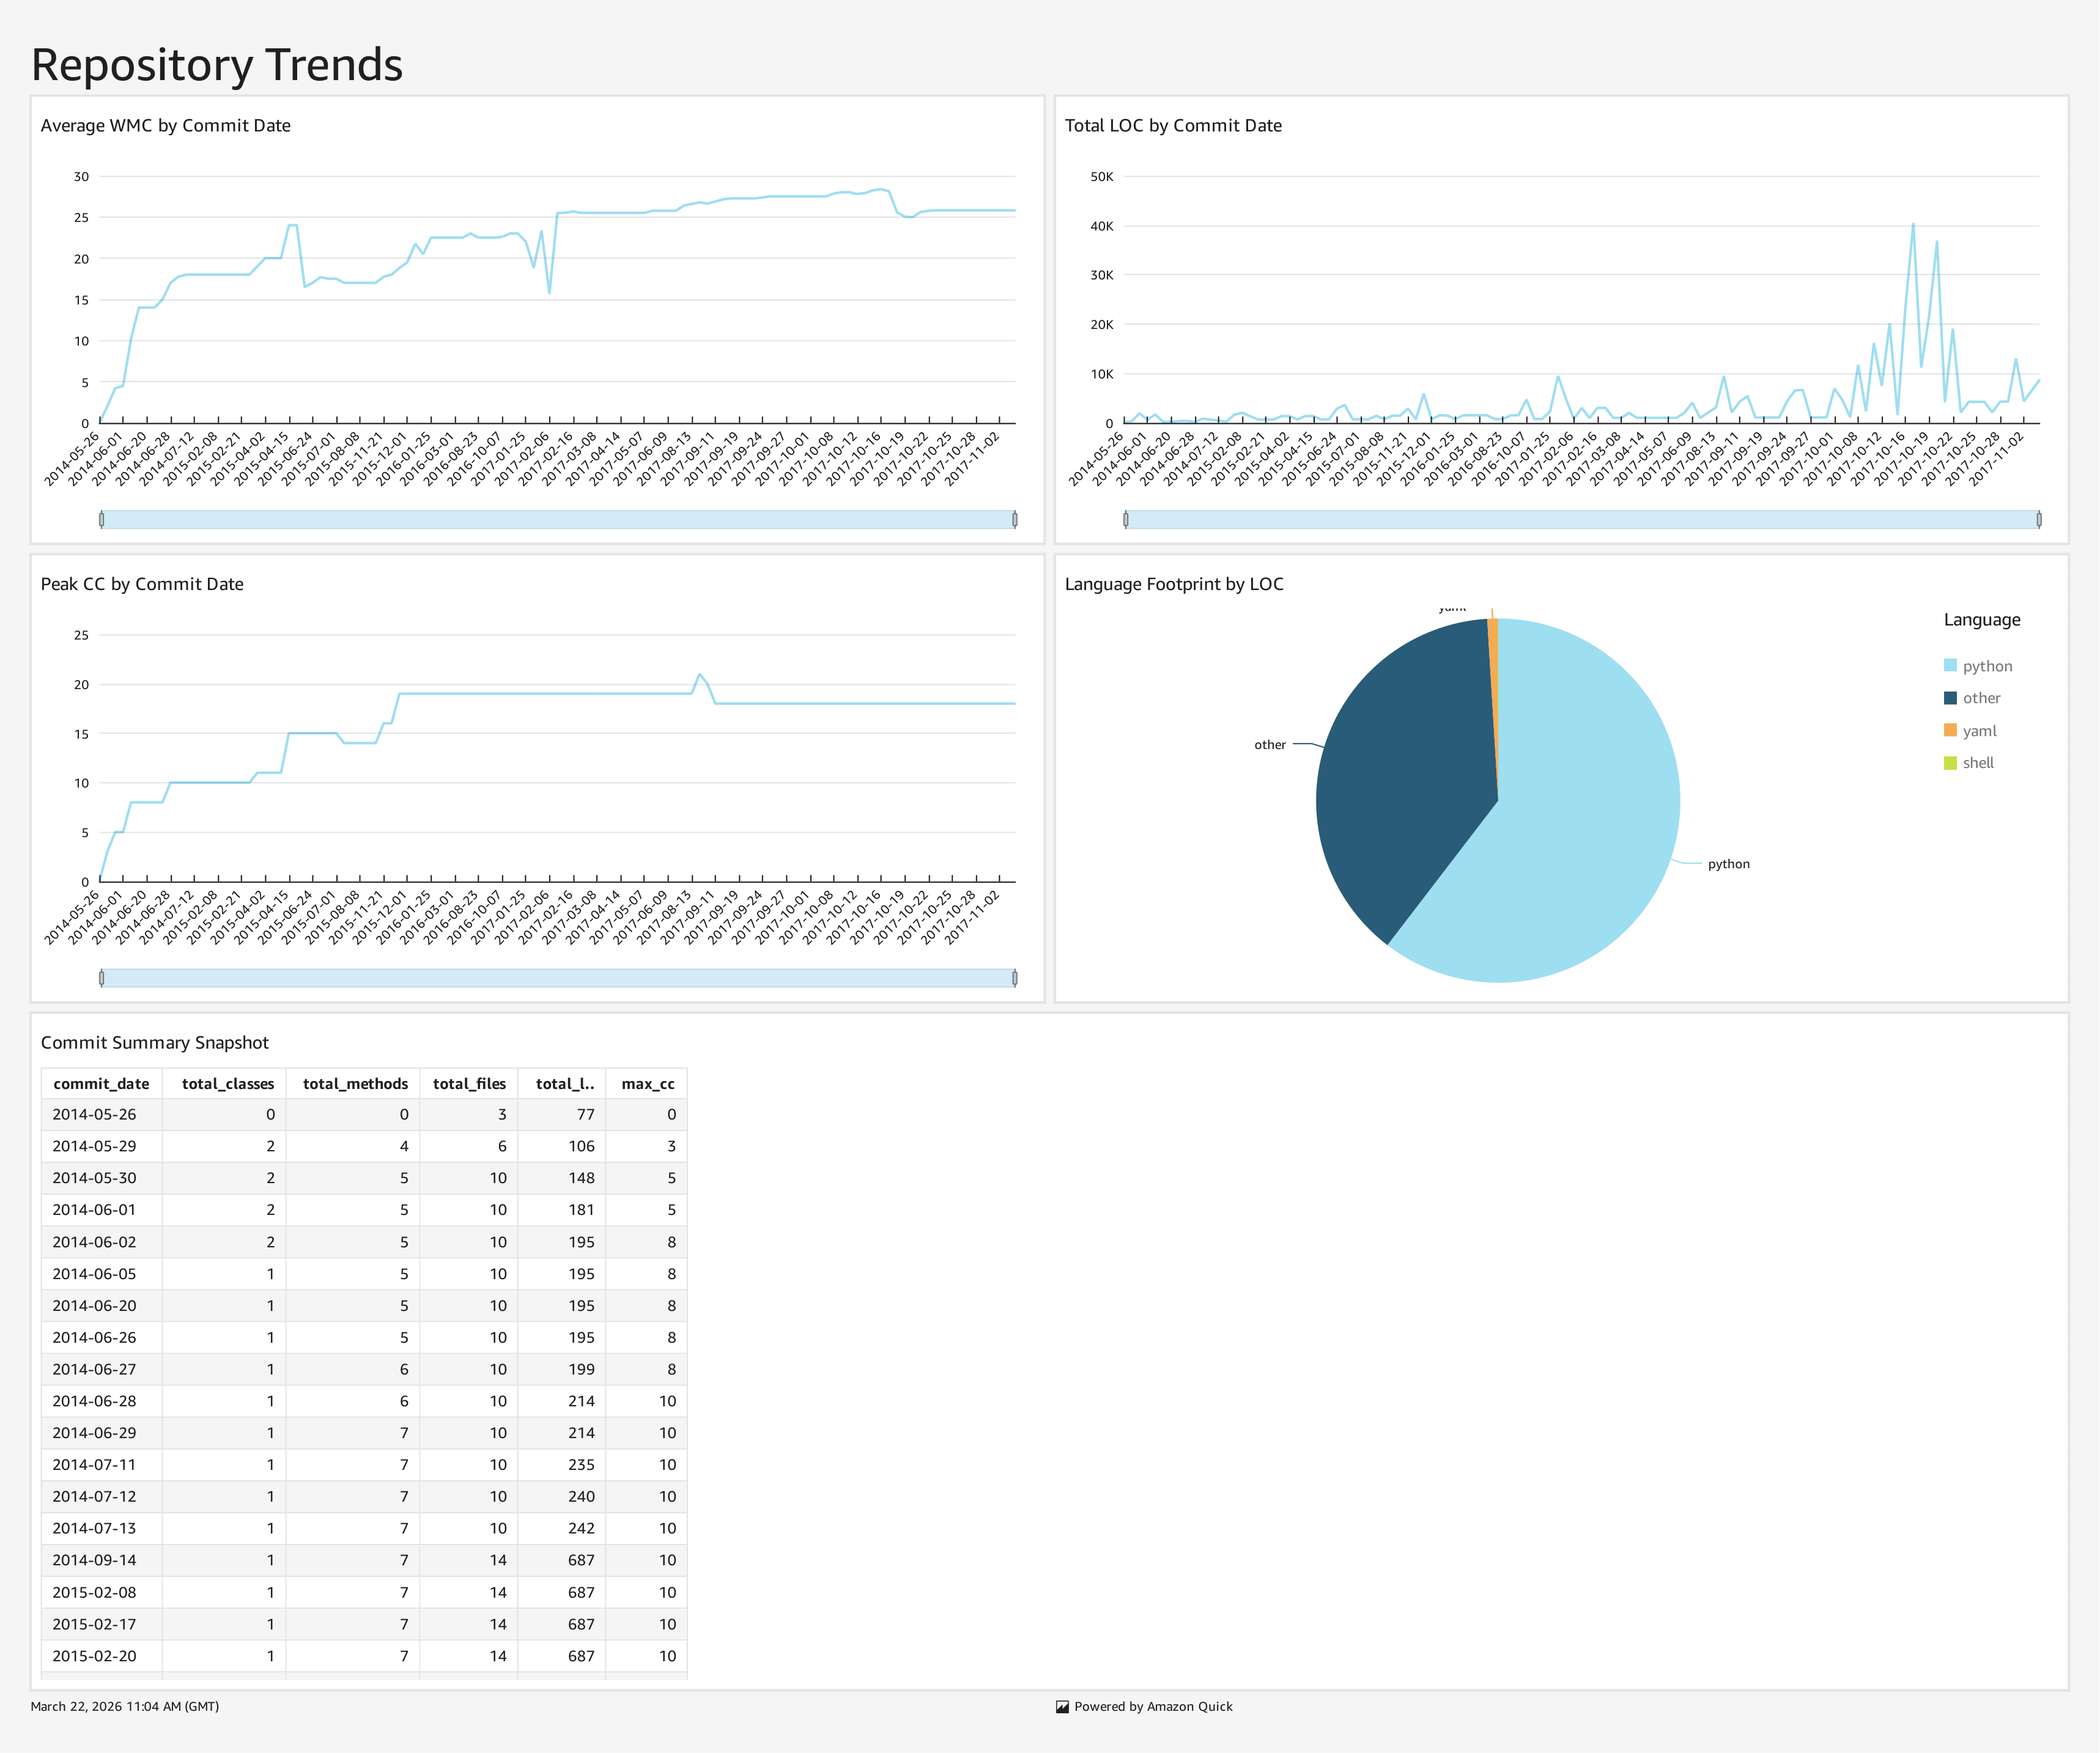
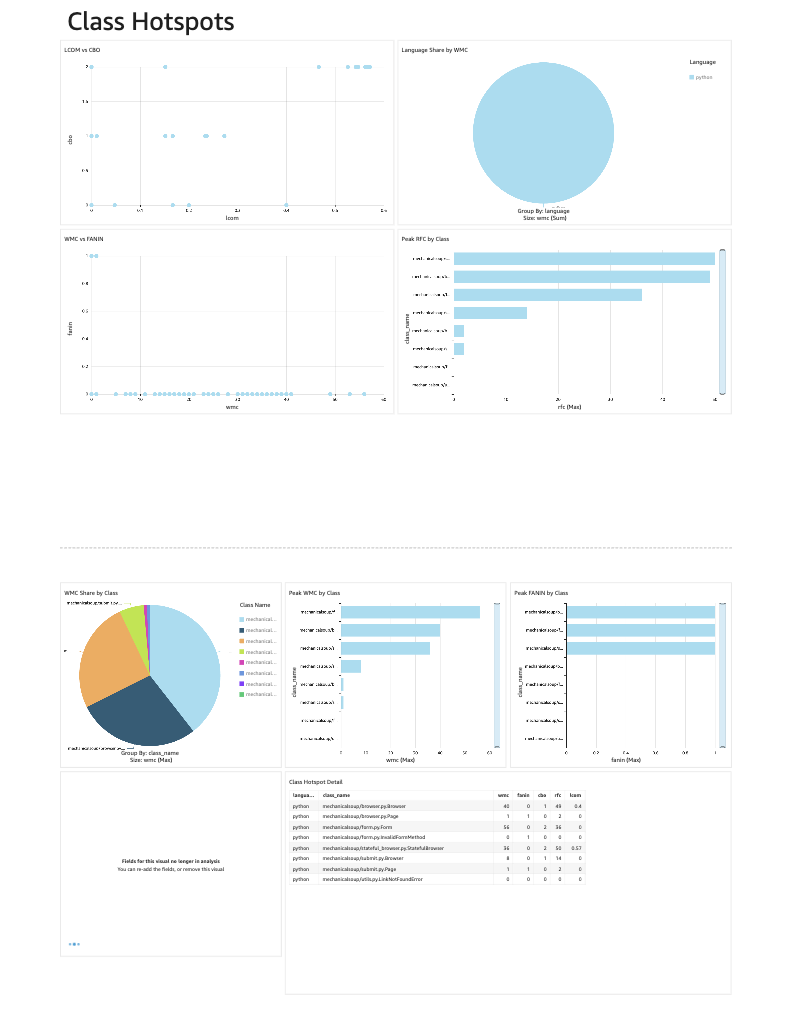
Athena queries code-health tables and QuickSight presents repository trends, class hotspots and method-level signals.
04 / Decisions
Repository analysis can be heavier and longer-running than a small function workload. Containers give the analyser predictable packaging and runtime space.
Step Functions makes stages, retries and failure points visible instead of burying the full workflow inside one process.
Raw evidence remains intact while processed and curated outputs can evolve for query and dashboard consumers.
Explicit IDs give each run provenance and keep “latest” reporting from blending data across separate executions.
05 / Evidence
06 / Reflection
The strongest next step is to make cost and operability as visible as the data flow: add explicit budgets, service-level telemetry and a recruiter-friendly recorded run from repository URL to dashboard.